How to Find Which of Your Posts Get the Most Reach on TikTok, Instagram and YouTube
Short answer: put the last 30 days of posts from every account into one table, then score each post against its own account's average instead of against other accounts. Leave out posts that are still gaining views. The posts with the highest scores are your real winners, because they beat what that audience normally gives you.
Most people sort by raw views in each app and screenshot the top post. That finds your biggest account, not your best post. The steps below fix that. They work in a spreadsheet, and the second half shows the same job done on the Reach page.
Want to put this into practice? Schedule your first post free with TimeToPost and let it post at your best time.
Why sorting by raw views fools you
Post the same video to a large TikTok account and a small Instagram account. The TikTok copy wins on views almost every time. Sort a combined list by views and TikTok fills the top ten. You conclude that TikTok is where your content works, and you learned nothing about which video was good.
The cure is to ask a different question. Not "which post got the most views?" but "which post did better than that account usually does?"
Build the sheet
One row per post per account. Columns: date posted, platform, account, views, likes, comments, shares, saves, link clicks. Fill the numbers from each app's analytics screen. If a platform does not give you a number, leave the cell empty. A zero claims that nobody did the thing, and you do not know that.
Then clean it:
- Take out posts that are still collecting views. A post from this morning is not finished.
- Take out very small posts. With a handful of views, one share swings every ratio. The exact cutoffs we use are in when to repost your best video, where they matter most.
Score against the account
For each account, average the views and the engagement rate of its last 30 days of posts. Engagement rate is likes, comments, shares and saves divided by views. The engagement rate calculator does the division.
Then score each post: its engagement rate divided by its account's average. Above 1 means better than usual. Below 1 means worse.
Here is how it reads on invented numbers:
- The morning routine clip on Account A: 6.2% against a 4.0% average. Score 1.55.
- The same clip on Account B: 3.2% against 3.1%. Score 1.03.
- The product demo on Account A: 2.0% against 4.0%. Score 0.50.
The same clip scores 1.55 on one account and 1.03 on the other. The clip landed where the audience wanted it. That is something a raw view count would have hidden.
Read the top and the bottom
Sort by score and write one line for each of the top five and the bottom five: the hook, the length, the subject, the hour it went out. After three or four weeks of this, patterns show up. One week is a coincidence.
What the sheet cannot tell you
Views and engagement say what people did. They do not say why. Platforms also count a view in their own way, so a view on one app is not the same unit as a view on another. That is one more reason to compare each account only with itself. For the why, read the comments on your top and bottom posts. It is the cheapest research there is.
Doing it on the Reach page
The Reach page in the TimeToPost dashboard builds this table for you from every post TimeToPost published in the last 7 or 30 days. Each row shows views per platform side by side, with darker shading for bigger numbers, plus the post's engagement rate and its tracked link clicks. It is part of the Pro and Growth plans.
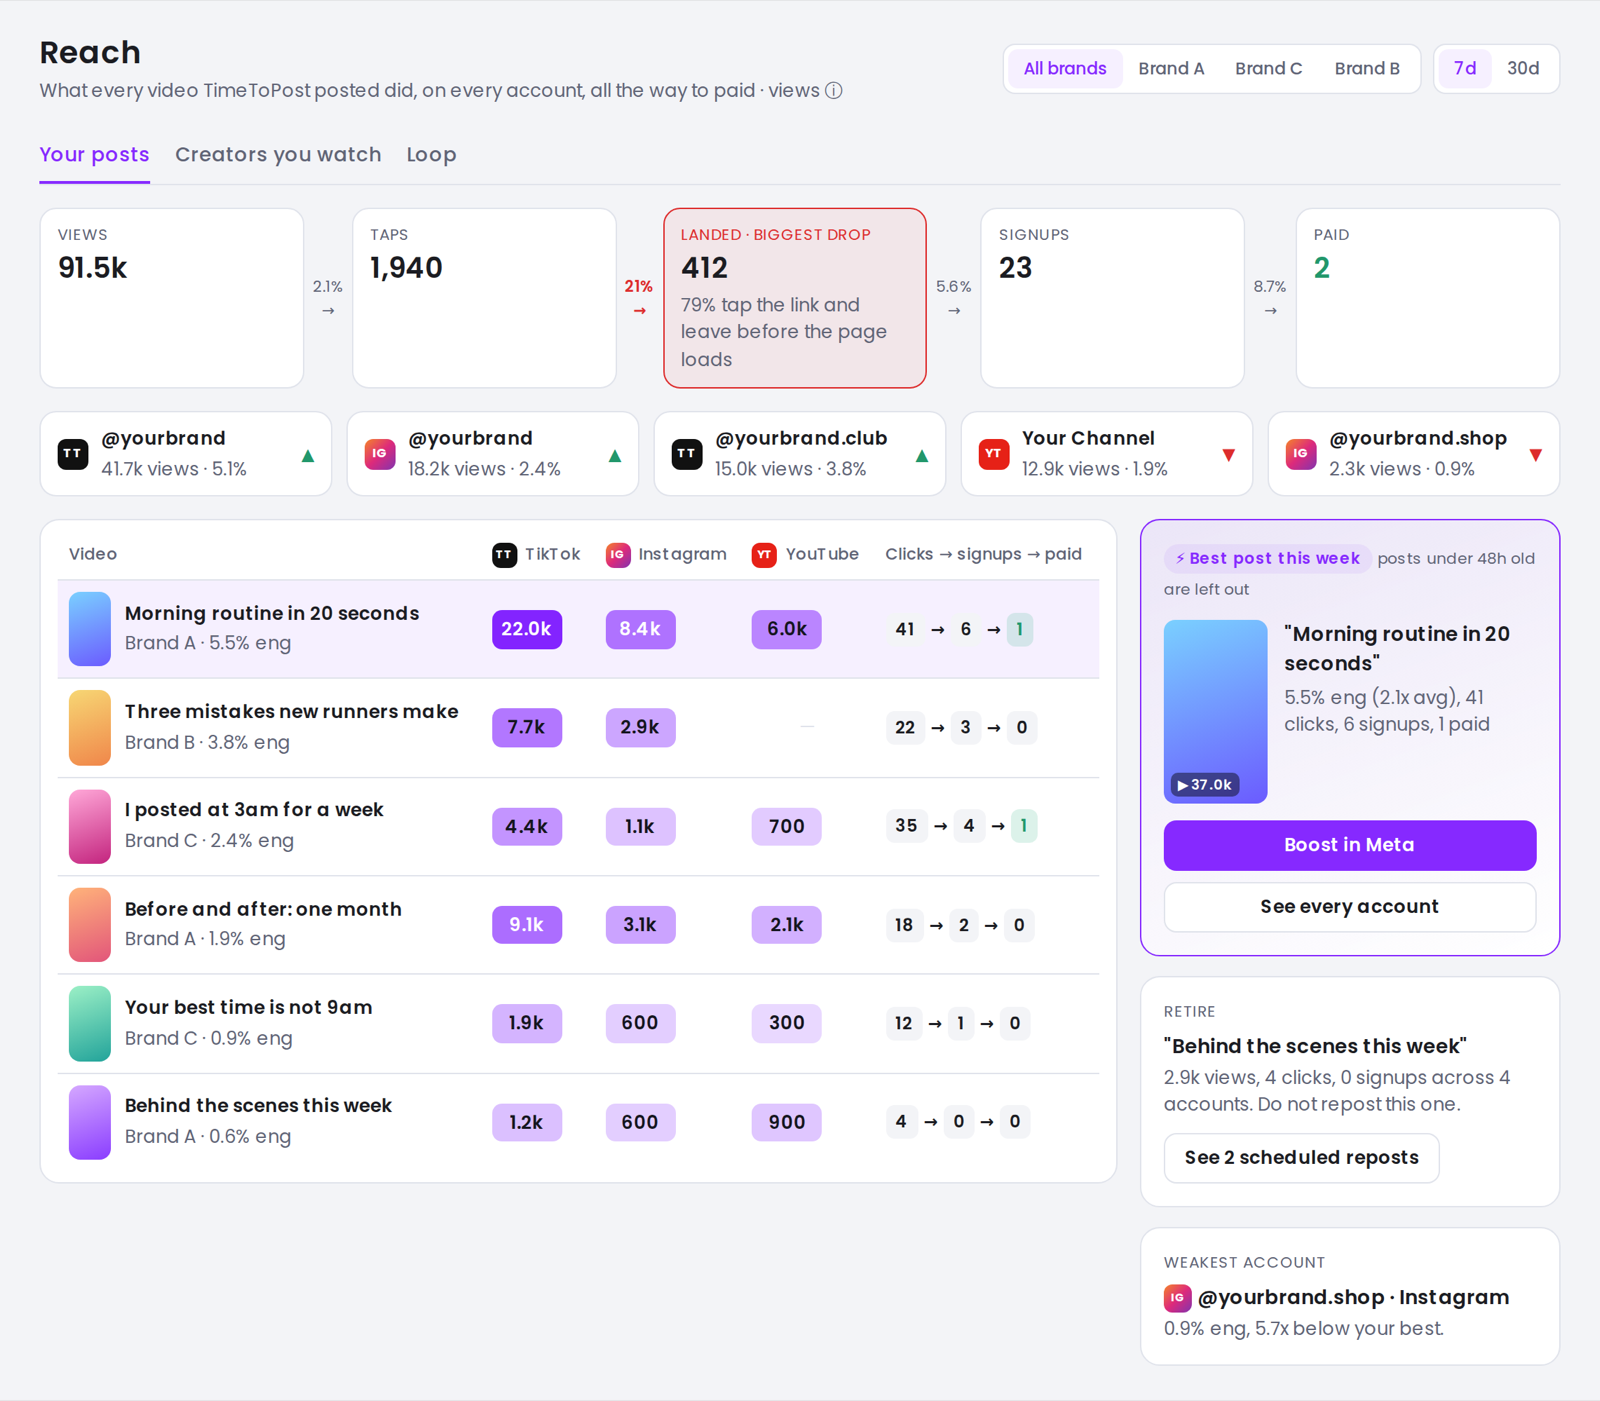
Screenshot with sample data.
A strip above the table lists each connected account with its views, its engagement rate and an up or down arrow against the previous period. That is your per-account baseline, kept current. The page then picks a "Best post this week", using the rule laid out in the repost guide.
Views come from TikTok, Instagram and YouTube, and the numbers refresh several times a day. There is no watch time or retention data on the page. Free and Starter users see their own totals blurred, with a trial button. The Reach feature page lists the rest.
What to do with a winner
Make another post on the same idea. Then decide whether to put the original back in the queue. For the habit of requeueing, see evergreen content recycling. For the signals that sit behind a good post, see the analytics you are ignoring.
FAQ
How do I find my best performing post on Instagram, TikTok and YouTube at once?
Put the posts from all three into one table with the same columns, then score each post against its own account's 30 day average. A tool like Reach does this for posts published through TimeToPost.
Should I judge a post by views or by engagement rate?
Use both. Views say how many people saw it. Engagement rate says whether they cared. Many views with a rate below the account's normal means the post reached people who did not care.
Why compare a post to its own account instead of to all posts?
Accounts differ in audience size. A raw ranking mostly shows which account is biggest. The score against the account's own average shows which post was actually good.
Does Reach show how long people watched?
No. There is no watch time or retention data. It shows views, engagement rate, link clicks and the likes, comments, shares and saves the platforms report.
I build TimeToPost.