Social Media Reach Tracker: See Your Views on TikTok, Instagram and YouTube in One Place
A social media reach tracker is one table that shows, for each post you published, the views it got on each platform, over the same time window, side by side. You can build one in a spreadsheet by copying numbers from each app once a week, or let a tool pull them in. The point is the same either way: stop opening three apps to answer one question.
This guide covers what to put in the table, the words that trip people up, a weekly check that takes ten minutes, and how the Reach page in TimeToPost tracks views across TikTok, Instagram and YouTube without a spreadsheet.
What the table should hold
Keep it small. A tracker with fifteen columns is a tracker nobody updates.
| Column | Why it is there | |---|---| | Post (title or first line) | So you can recognize it | | Date posted | Lets you skip posts still gaining views | | Platform and account | One post can go to several | | Views | The reach number | | Engagement rate | Likes, comments, shares and saves divided by views | | Link clicks | Whether the post sent anyone anywhere |
One row per post per platform is the cleanest way to store it. A second sheet grouped by post shows the same video on three platforms in one line.
Reach, impressions and views
People use these loosely, and the apps do not agree with each other. A working split:
- Reach usually means the number of different people who saw something.
- Impressions usually means the number of times it was shown, so one person can count twice.
- Views is the plays or opens a post gets. Instagram now reports views as its main number.
Each platform defines these in its own words. So do not add a TikTok view and an Instagram view and call the sum a count of people. Call it what it is: total plays across platforms. To compare posts, use views per account and judge each against its own average, as in how to find which posts get the most reach.
The ten minute weekly check
- Pick the window: last 7 days for the week, last 30 for the trend.
- Add new posts and refresh the views on older ones.
- Mark the posts that are only a day or two old. They are still counting.
- For each account, compare this period's views with the last period. Up, down or flat is enough.
- Write one decision, not an observation: "three more clips like Tuesday's", or "stop sending the demos to this account".
If it takes longer than ten minutes, the sheet has too many columns.
What a tracker will not tell you
Views count what happened. They do not say whether people stayed to the end. For that you need watch time or retention, which the platforms' own studios show and a view tally does not. Reach has no watch time or retention data either. Use the tracker for the what and the platform's studio for the why.
Also check the last-updated time. Platforms report late, and some numbers keep moving for days.
How Reach tracks views across platforms
Reach lives at /dashboard/reach in your TimeToPost workspace and comes with the Pro and Growth plans. For every post TimeToPost published in the last 7 or 30 days it puts views per platform in one table, with darker shading on bigger numbers, so the best posts stand out without reading every cell.
Three details that matter:
- A strip above the table has every connected account with its views, its engagement rate and an up or down arrow against the previous period. That is step four of the weekly check, done for you.
- Each post has its own detail page with engagement by account, likes, comments, shares, saves, link clicks and a list of recent clicks.
- If an account lost permission, its row says "needs a new login" and offers a Reconnect link, instead of quietly showing stale numbers.
Views come from TikTok, Instagram and YouTube, and the numbers refresh several times a day, not live. Free and Starter users see their own totals blurred, with a trial button.
The Loop tab: which accounts got what
A second tab, Loop, draws the path of your posts. Posts sit on the left, each connected account in the middle, and that account's numbers on the right. It answers a different question from the table: not "which post did best?" but "where did my posts go, and what did each account do with them?"
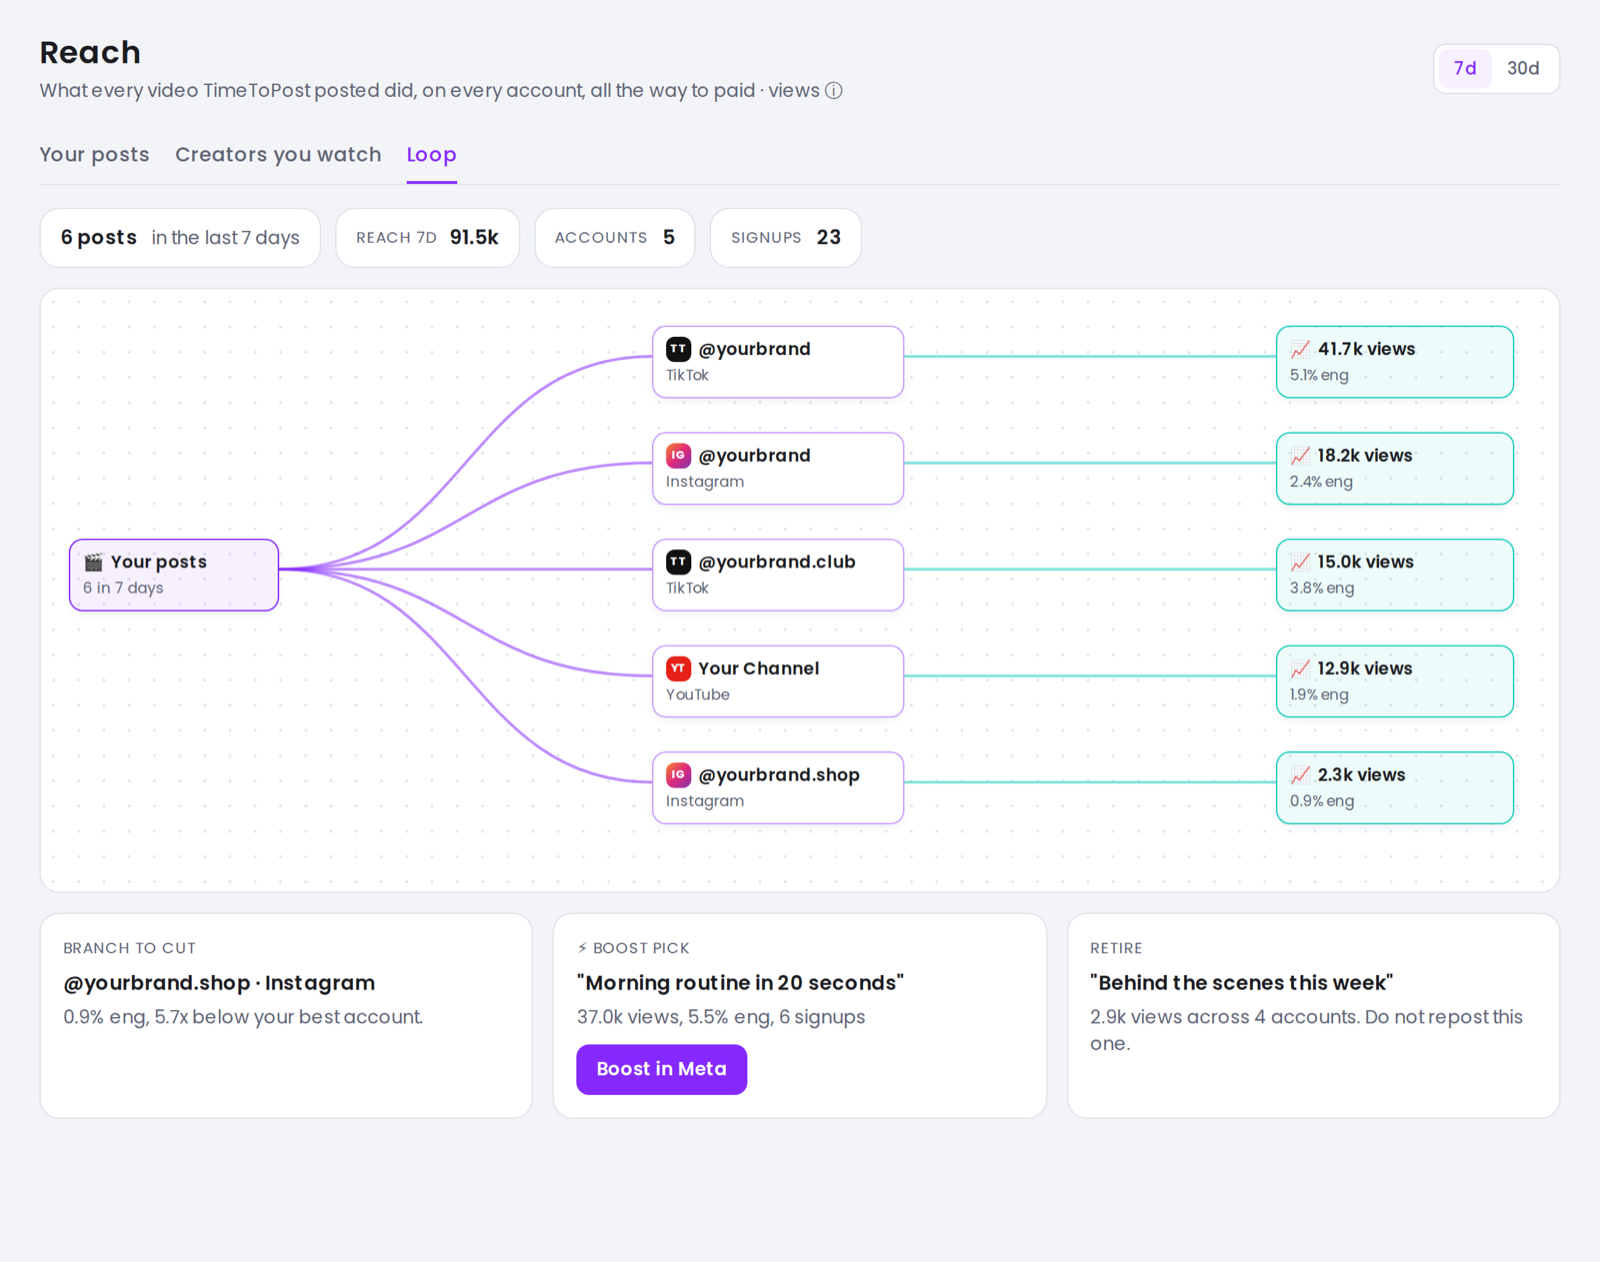
Screenshot with sample data.
If one account gets a tenth of the views your best account gets, the Loop shows it at a glance. The Reach feature page has the rest.
A tracker should change what you post
Each week it should push you to do something: repost one thing, retire one thing, copy a format. The rule we use for reposts is in when to repost your best video. To check a post's engagement against a benchmark, use the engagement rate calculator.
FAQ
What is a social media reach tracker?
A table or tool that shows how many views your posts got on each platform, usually over the last 7 or 30 days, so you can compare posts and accounts without opening each app.
Can I track my posts in a spreadsheet?
Yes. One row per post per platform, with date, views, engagement rate and link clicks, updated weekly, is enough for a few accounts. It gets tedious once you post daily to several.
Is reach the same as views?
No. Reach usually counts different people. Views count plays or opens. Platforms define both differently, so do not add them up as if they were one unit of people.
How often do the numbers update in Reach?
Several times a day. They are not live, and platforms are sometimes late in reporting views.
I build TimeToPost.